banner

← Back to Blog

5 Signs It Might Be Time to Reevaluate Your Reporting Strategy

Reporting platforms often remain in place for years because replacing them feels risky. But as institutional expectations evolve, many campuses — including those using WebFOCUS — are taking a fresh look at whether their current BI environment still meets the needs of students, faculty, administrators, and leadership. 

If your institution relies on WebFOCUS today, here are five common signs institutions tell us they experience when evaluating whether it’s time to explore new reporting approaches. 

1. IT is Handling More Reporting Work Than Ever

Institutions using WebFOCUS frequently share that their IT teams spend substantial time supporting report creation, troubleshooting, or adjustments. Over time, this level of involvement can strain resources and slow strategic progress. 

2. Users Rely on Workarounds

When WebFOCUS feels challenging to navigate, Users often revert to Excel exports, manual reporting, or departmental workarounds. This creates inefficiency and introduces governance challenges. 

3. ROI Is Hard to Demonstrate

Some institutions share concerns about whether usage, support requirements, and training demands align with the overall investment in their WebFOCUS environment. 

4. Collaboration Feels Cumbersome

Institutions increasingly want to collaborate directly around data — share Dashboards, discuss trends, annotate changes, and work together in real time. When collaboration isn’t seamless, insights stay siloed. 

5. Alignment With Future Strategy is Uncertain

Institutions transitioning to SaaS ecosystems, modern data warehouses, or new governance structures sometimes question whether their current WebFOCUS environment provides the flexibility they’ll need over the next decade. 

The Tipping Point 

Experiencing one or two of these scenarios is manageable. But when several begin stacking up at once, many institutions using WebFOCUS are choosing to explore BI alternatives that offer more intuitive interfaces, stronger governance, and greater independence for Users. 

What Institutions Look for When Evaluating Alternatives 

When campuses begin exploring new options, they often prioritize: 

  • Modern, intuitive interfaces 
  • Governed self-service for User independence 
  • Reduced report backlogs 
  • Performance that supports large datasets 
  • Collaboration features built into the platform 
  • Strong mobile access 
  • A predictable cost structure 
  • Integrations with core systems such as Banner or Colleague 


Your Next Step 

If your institution uses WebFOCUS and is reassessing its long-term reporting strategy, we’re happy to share how other campuses are modernizing their approach. 

Read More
← Back to Blog

The Hidden Costs Institutions Overlook in Their BI Strategy

Higher education institutions depend on their Business Intelligence systems to support critical decisions across enrollment, finance, student success, and operations. But as reporting needs grow and data expectations shift, many campuses, including institutions using WebFOCUS, are taking a closer look at the less visible costs wrapped into their BI strategy. 

These costs aren’t always captured in a licensing agreement or annual budget. Instead, they show up in the operational effort required to support reporting, maintain data consistency, deliver insights efficiently, and keep Users confident in the tools they rely on every day. 

If your institution uses WebFOCUS today, understanding these hidden costs can help you evaluate whether your current BI environment continues to align with your long-term needs. 

Visible Costs (Only Part of the Story) 

While licensing, modules, and support contracts are well understood, institutions often share that these only represent a portion of the total investment in a mature reporting environment like WebFOCUS. 

Licensing and Scaling 

Many campuses note that licensing may grow as they expand reporting access or broaden the scope of their BI usage. This can make long-term budgeting more complex, especially when institutions want to democratize data widely across departments. 

Limited Out-of-the-Box Features 

Many institutions tell us that WebFOCUS provides a relatively small set of native visualization options. As reporting needs become more sophisticated, campuses often find they need additional configuration work or custom development to create the dashboards or visual layouts their users expect today. 

Maintenance and Upgrades 

IT teams routinely describe the ongoing work involved in keeping WebFOCUS aligned with other campus systems such as ERPs, CRMs, or student success platforms. 

Hidden Costs (Where Institutions Feel the Most Impact) 

IT Time and Reporting Support 

One of the most consistent themes we hear from institutions using WebFOCUS is the growing volume of reporting support required from IT: 

  • Creating or modifying Reports 
  • Helping Users interpret data 
  • Troubleshooting Report logic 
  • Maintaining queries and Data Views 
  • Managing Banner or ERP joins and integrations 
  • Training on using the system


As reporting demands grow, this workload can make it difficult for IT to focus on long-term projects. 

Self-Service Adoption Gaps 

Many WebFOCUS institutions tell us that despite training, some users still rely heavily on IT for routine reporting needs. This dependency can slow decision cycles and prevents Users from accessing the information they need independently. 

Outdated User Interface 

The UI in WebFOCUS often feels dated, which can slow users down and make even basic tasks feel more complicated than they should. 

Workarounds and Data Governance Risks 

When Users find WebFOCUS challenging to navigate, they often export Data Views or Reports into spreadsheets. While common across BI tools, this leads to: 

  • Different versions of the same data 
  • Siloed analysis 
  • Manual data manipulation 
  • Increased governance risk


These indirect costs can significantly affect institutional efficiency. 

The ROI Question for WebFOCUS Institutions 

After considering both visible and hidden costs, institutions often ask: 

  • Are we spending too much time supporting report requests? 
  • Do our Users have the independence they need? 
  • Are we meeting expectations for sharing and collaboration? 
  • Does our BI environment align with our long-term data strategy and governance model? 
  • As we move toward cloud or SaaS ecosystems, does our current approach scale with us? 


These questions frequently lead institutions to explore modern alternatives that may better support the next decade of reporting needs. 

What Institutions Prioritize When Exploring Alternatives 

When institutions evaluate modern BI platforms, they often focus on: 

  • Intuitive, user-friendly web interfaces 
  • Governed self-service capabilities 
  • Reduced dependency on IT 
  • Strong handling of large, complex institutional datasets 
  • Built-in collaboration tools 
  • Predictable pricing structures 
  • Integration with Banner, Colleague, and other SIS/ERP environments 


Your Next Step 

If your institution uses WebFOCUS and is reassessing its BI roadmap, our team can share real examples of how institutions are modernizing their reporting environments in ways that support governance, self-service, and institutional agility. 

Read More
← Back to Blog

10 Signs Your Institution Needs a Unified Data Platform

Most organizations don't wake up one day and realize their data infrastructure is broken. The cracks show up gradually. A report that takes three weeks to build, another vendor added to solve a niche problem, teams working from different versions of the truth. If you're reading this, you probably already suspect something needs to change. Here are ten warning signs that it's time to consolidate your data platform. 

The 10 Warning Signs 

1. You Have Multiple Tools Doing Similar Jobs

You've got a reporting tool, a separate dashboard tool, something else for ad-hoc queries, and another platform for operational reports. Each one made sense when you bought it, but now your team spends more time figuring out which tool to use than actually analyzing data. 

2. Simple Reports Take Days or Weeks

When a department head asks for a straightforward report—enrollments by program, budget variance by department—it shouldn't require a project plan. If your team is constantly backlogged with "simple" requests, your platform is the bottleneck. 

3. IT Becomes a Translation Layer

Your business users know what questions they need answered, but they can't get to the data themselves. Every request goes through IT to translate business logic into technical queries. IT becomes a perpetual middleman instead of a strategic partner. 

4. Different Departments Report Different Numbers

Finance says enrollment is one number. Admissions says it's another. The Registrar has a third version. Everyone is technically correct based on their data source, but nobody agrees. This isn't a data problem—it's a trust problem caused by fragmented systems. 

5. You're Manually Combining Data in Spreadsheets

Your team exports data from System A, exports from System B, then spends hours in Excel using VLOOKUP to merge them. This isn't analysis—it's data janitorial work. And it's error-prone. 

6. Vendor Lock-In Prevents Progress

You want to add a new data source or build a new type of report, but your current vendor says it'll require custom development, extra licensing, or "isn't supported in this version." You're paying for a platform but renting limitations. 

7. Data Governance Is Impossible

You can't track who has access to what data, how definitions are applied, or where reports are being used. Security and compliance feel like a game of whack-a-mole because you have no centralized control. 

8. Onboarding New Users Takes Months

New analysts or department heads need extensive training across multiple systems. By the time they're productive, they're either frustrated or have learned workarounds that create more data silos. 

9. You're Paying Multiple Vendors for Incomplete Solutions

Your BI budget is spread across 4-6 different vendors. None of them talk to each other well. You're paying for redundant capabilities and integration headaches but still don't have a complete solution. 

10. Nobody Trusts the Data Enough to Make Big Decisions

This is the ultimate warning sign. When leadership needs to make strategic decisions, they ask for audits, manual verification, or "can you double-check this?" The data platform should build confidence, not erode it.

Self-Assessment Checklist 

Before you talk to vendors (including your current one), get clear on where you actually stand:  

Data Access & Usability 

  •  Can non-technical users build their own reports without IT help? 
  •  Do reports pull from a single source of truth? 
  •  Can users explore data interactively without pre-built reports? 
  •  Is your average time-to-report measured in hours, not days? 


Integration & Architecture 

  •  Can you connect to all your critical data sources without custom coding? 
  •  Do your systems share consistent definitions and business rules? 
  •  Can you add new data sources without a vendor engagement? 
  •  Do you have a clear data lineage for audit purposes? 


Team Productivity 

  •  Does your BI team spend more time building new insights than maintaining existing reports? 
  •  Can departments answer their own questions without waiting in a queue? 
  •  Do you have time to focus on predictive analytics, not just historical reporting? 


Cost & Value 

  •  Do you know your total cost of BI across all tools and vendors? 
  •  Are you getting measurable ROI from your BI investments? 
  •  Can you scale without proportional cost increases? 


Governance & Security 

  •  Can you control data access at a granular level? 
  •  Do you have audit trails for compliance requirements? 
  •  Are business definitions documented and consistently applied? 


If you checked fewer than 75% of these boxes, you're likely dealing with a fragmented data environment that's holding your organization back.

Questions to Ask Your Current BI Vendor 

Whether you're evaluating a new platform or assessing your current one, these questions cut through the sales pitch:  

Architecture & Integration 

  • How many of our data sources can you connect to natively, without custom development? 
  • What happens when we need to add a new data source you don't currently support? 
  • Do we need separate products for reporting, dashboards, and data prep—or is it unified? 
  • Can business users create their own data models, or does everything go through IT? 


Usability  

  • How long does it typically take to train a non-technical user to be self-sufficient?  
  • Can users drill down into data and ask follow-up questions without building new reports?  
  • What does your mobile experience look like for on-the-go access?  


Total Cost  

  • What's our all-in cost including licensing, maintenance, training, and required infrastructure?  
  • Are there hidden costs for things like additional connectors, user seats, or data volume 
  • How do costs scale as we add users or data sources?  


Vendor Relationship  

  • What does your support model look like? Do we get a dedicated contact or a ticket queue? 
  • How often do you release updates, and what's the upgrade process?  
  • Can we see your product roadmap? How much influence do customers have?  
  • What's your typical customer retention rate?  


Security & Compliance  

  • How do you handle row-level and column-level security? 
  • What compliance certifications do you maintain (SOC 2, FERPA, HIPAA, etc.)?  
  • Can we keep data on-premises if required, or are we forced into the cloud?  


Proof Points  

  • Can you show us a reference customer similar to our institution who's had success? 
  • What's your average time-to-value for implementations?  
  • What's the #1 reason customers leave your platform? Pay attention not just to what they answer, but how they answer. Vague responses, deflection to "that's on the roadmap," or "we can custom-build that" are red flags.

Why Organizations Choose Informer 

We're not going to tell you that Informer is the only data platform that works. But if the signs and questions above resonated with you, here's why Informer might be worth a conversation. 

Built for Real Users, Not Just Data Teams  

Informer was designed around a simple idea: the people who understand the business best should be able to answer their own questions. No SQL required. No waiting for IT. Business users can explore data, build reports, and create dashboards without becoming data engineers.  

One Platform, Complete Capability  

You're not buying separate products for data prep, reporting, dashboards, and analytics. Informer is a unified platform that handles everything from data integration to visualization. One vendor. One licensing model. One place for your team to master.  

Connect to Everything  

Whether your data lives in a modern SaaS platform, a legacy system, a database, or a spreadsheet, Informer connects to it. And when you need to add a new source, you're not waiting for the next release cycle or paying for custom development.  

Governed by Default  

Data security, user permissions, and audit trails aren't add-ons—they're built into the core Informer platform. You define business rules and definitions once, and they're consistently applied everywhere. Different departments can work independently while still operating from the same source of truth.  

Built for Your World  

Entrinsik, the company behind Informer, has spent years working with complex organizations in higher education, healthcare, insurance, local government, and nonprofits. We understand compliance requirements, budget constraints, and the reality of working with legacy systems that can't just be ripped out.  

Access Anywhere You Work 

Whether you're at your desk, in a meeting, or traveling between campuses, Informer delivers consistent functionality across all your devices. Our responsive web platform automatically adapts to your screen size, providing full functionality on laptops, tablets, and smartphones. We're also developing enhanced mobile and desktop applications that will bring even more powerful on-the-go capabilities—because we believe mobile access shouldn't mean compromised functionality.  

You're Not Just a License Number  

When you work with Informer, you get dedicated support, regular training, and access to a community of users facing similar challenges. We improve the platform based on real feedback from customers like you, not just what sounds good in a boardroom.
 

What Happens Next? 

If you recognized your institution in these warning signs, the path forward is straightforward: 

  • Run the self-assessment with your team to document your current state 
  • Calculate your true cost of your current BI environment (include vendor costs, IT hours, opportunity cost) 
  • Ask your current vendor the hard questions—their answers will tell you what you need to know 
  • Talk to alternatives like Informer to understand what's possible 


Your data platform should be an accelerator, not an anchor. The right unified platform pays for itself quickly, not just in reduced vendor costs, but in faster decisions, better insights, and teams that spend their time solving problems instead of fighting with tools.  

If you want to see how Informer handles your specific use cases, let's talk. No pressure, no sales pitch, just a real conversation about whether we're the right fit for your institution. 

Ready to explore what a unified data platform could do for your organization? 


Read More
← Back to Blog

Elevating Banner: How Our Recent Ellucian SaaS Verification Empowers Your Institution

We’re excited to share that Informer is now officially Ellucian SaaS Verified for Banner, a milestone that brings tremendous value to our current and future customers in the higher education space. 

What Does This Certification Mean for Your Banner SaaS Environment? 

If your institution is running Banner in the Ellucian SaaS environment, this certification confirms that Informer has met rigorous technical and security standards set by Ellucian. It means you can confidently leverage Informer to connect with Banner SaaS data quickly, securely, and without heavy IT lift. 

Seamless Integration, Smarter Reporting 

At Entrinsik, we know how important real-time data access is in today’s higher education landscape. Whether you're in institutional research, enrollment, or finance, you need reliable insights without jumping through technical hoops. Informer was built for exactly that. With our native Ellucian Banner connector, schools can effortlessly pull data and build powerful dashboards, reports, and AI Assistants all without needing complex backend work. 

Future-Proof Your Analytics Strategy 

The SaaS Verified status doesn’t just mark a technical milestone - it’s also a sign of our ongoing commitment to staying aligned with Ellucian’s roadmap. As more institutions transition to SaaS, having a trusted, certified analytics solution ensures your reporting capabilities grow right alongside your infrastructure. 

Let’s Show You What It Can Do 

If you’re a Banner school exploring SaaS or already running in that environment, I’d love to show you what Informer can do. You’ll see how simple, secure, and smart it can be to access the data that drives better decisions. 

Let’s set up a time to chat. 

Thanks for being part of the journey with us - this is just the beginning. 


Andrea Fichtel
Sales Director | Entrinsik
entrinsik.com/informer 

Read More
← Back to Blog

Upgrade Your Reporting Experience: A Fresh Approach for Banner Institutions

For years, Ellucian Banner institutions have relied on Business Objects to fulfill core reporting needs—but the expectations placed on institutional data are changing. 

Stakeholders want faster insights, easier access to reports, and tools that don’t require deep technical expertise. IT teams are being asked to deliver more with fewer resources. And leadership needs timely, trustworthy data to drive decisions. 

If Business Objects no longer fits the way your institution works—or where it’s headed—it may be time to explore a new approach. 

Informer by Entrinsik is a modern reporting platform designed specifically for higher education. With governed access, real-time integration, and user-friendly tools, Informer enables Banner institutions to rethink what’s possible with their data. 

Built to Align with Banner 

Informer connects directly to your Banner database, supporting live access to the data structures your teams use every day. Whether it’s tracking financial aid, enrollment, or student performance, Informer helps you surface and share insights across departments—securely and efficiently. 

Unlike generic business intelligence tools, Informer understands how institutions operate. You can build Reports, customize Dashboards, and automate distribution without relying on complex scripting or external consultants. 

Empower Users with Modern Reporting Tools 

Business Objects served its role, but reporting expectations have evolved. Informer brings a modern, intuitive experience that empowers teams to do more—without overburdening IT. 

With Informer, your institution can: 

  • Build interactive Dashboards, Visualizations and Reports that update automatically 
  • Use AI Copilot to create Ad hoc Queries in natural language 
  • Design reusable Templates and Data Views to deliver the right data, to the right people, at the right time 
  • Automate report distribution with secure sharing and scheduling features 
  • Maintain governance with role-based Security and audit trails


The result? Smarter decisions, faster access to insight, and less dependency on technical staff for everyday reporting. 

A Guided Migration Path with Higher Ed Experts 

One of the biggest concerns in upgrading legacy systems like Business Objects is the transition itself. That’s why Informer’s implementation approach is built around higher education needs and timelines. 

Our Customer Success Team brings deep experience working with Banner institutions. From project kickoff to rollout, we work collaboratively to understand your goals, translate your existing reporting needs, and deliver a solution that fits your structure.  

What you can expect: 

  • A phased implementation aligned to your timeline
  • Prioritize critical reports 
  • Rebuild and optimize reporting logic 
  • Expert support mapping Business Objects logic into Informer 
  • End-user training and knowledge transfer 
  • Strategic guidance for ongoing growth and adoption 
  • Establish governance policies that align with your institution’s goals 

Trusted by Institutions Across the Ellucian Ecosystem 

Nearly 500 institutions using Ellucian systems trust Informer to power their reporting. Our strong presence in the Ellucian ecosystem is no coincidence—Informer was designed with higher education in mind, and our team has decades of experience supporting the reporting needs of colleges and universities. 

Move Beyond the Constraints of Business Objects 

If your institution is ready for more than just static reports and technical bottlenecks, Informer offers a proven, purpose-built path forward. With seamless Banner integration, flexible tools, and a support team that understands higher education, Informer helps you upgrade not just your reporting software, but your entire reporting experience. 

Explore how Informer can support your transition and improve decision-making across campus. 

Read More
← Back to Blog

Better Decisions With Better Reporting for Ellucian Banner

In today’s data-driven business environment, organizations need to have access to relevant information at the right time. That is where business intelligence (BI) solutions help. Informer is a BI solution designed for higher education users to connect to their specific data sources to generate reports, dashboards, and analytics. 

Informer is particularly useful for institutions using Ellucian Banner, an enterprise resource planning (ERP) solution for colleges and universities. Informer enables Banner users to easily access, analyze, and combine data stored in the Banner system and other data sources, allowing them to gain actionable insights.  

One benefit of Informer that sets it apart from other BI solutions is its user-friendly nature. Informer empowers end-users to create reports and dashboards without relying on IT. Business users can quickly and easily generate the insights they need to make informed decisions rather than waiting for IT to develop custom reports, often saving limited IT time and resources.  

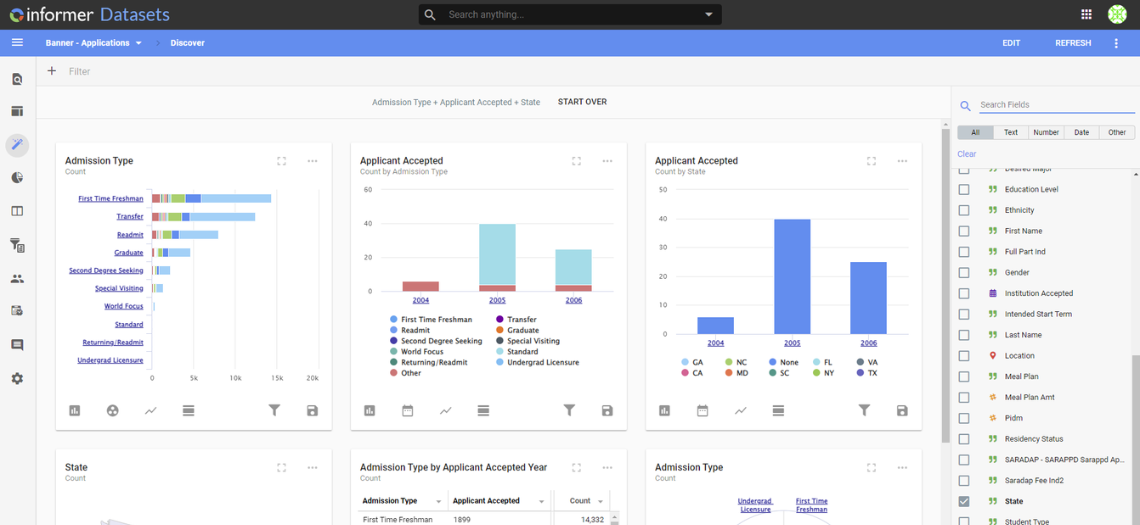
Informer can show many types of insights based on the data stored in Banner. Some examples of insights that Informer can provide include:  

  1. Enrollment Trends: This includes application, admission, and student enrollment patterns over time, including the number of students enrolled, the programs they are enrolled in, and their demographic data. These insights can help institutions identify areas where they may need to invest resources to improve enrollment.  
  1. Financial Health: Informer can help institutions track their financial performance, including revenue, expenses, budget variances, and fundraising. Informer assists in identifying areas where schools may need to adjust or allocate resources to ensure financial sustainability.  
  1. Student Performance: Some examples of student performance metrics include grades, retention rates, and graduation rates. Identifying at-risk students and areas where the institution may need to provide additional support to students can improve academic success.  

By using Informer in conjunction with Ellucian Banner, institutions can empower end-users to generate their own reports and dashboards, enabling them to make informed decisions based on real-time data to improve learning. Click here to learn more about how Informer can help your institution.

Read More